Dental Implant Success Rates: What Sixty Years of Data Actually Show
One percentage gets quoted everywhere. Here is where it comes from, what it leaves out, and how I use the real numbers when I plan a case.


Written and medically reviewed by Dr. Sam Jain, DMD, MS, and Dr. Arpana Gupta, DDS, MDS
Published
In this article
- 1Why I stopped quoting one number
- 21965 to 1986: the studies that defined the terms
- 3The ten-year reviews, read carefully
- 4The implant survives; the crown is another matter
- 5Registry data: what happens outside university clinics
- 6What moves a patient toward the top of the range
- 7Where the research has to go next
Why I stopped quoting one number
Patients ask me one question before surgery more than any other, and it is not about pain or cost. It is “what are the odds this works?” For years the industry answered with a single figure — 95%, sometimes 98% — quoted with no time frame, no definition and no population attached. I have stopped doing that. Not because the number is wrong, but because it is meaningless without the three things that give it meaning: how long the implants were followed, what counted as a failure, and who the patients were.
This page is my attempt to answer the question properly. I have gone back to the primary studies: the Swedish work that founded the field, the systematic reviews that pool tens of thousands of implants, and the population registries that show what happens when the same treatment is delivered by hundreds of ordinary clinicians rather than one university team. Every figure below is tied to a paper listed under Sources Reviewed at the end, and where two good papers disagree I say so rather than pick the one that flatters the treatment.
One distinction runs through all of it, and it is worth fixing in your mind now. Survival means the implant is still in the mouth. Success means it is still in the mouth and doing what it should — stable bone, no infection, a restoration that works. An implant can survive for a decade while losing bone every year of it. The literature reports survival far more often than success, because survival is easy to count and success needs criteria that not everyone agrees on.
1965 to 1986: the studies that defined the terms
The foundation is a paper from Gothenburg published in 1981. Adell, Lekholm, Rockler and Brånemark reported fifteen years of work, 1965 to 1980, in which 2,768 threaded titanium fixtures were placed in 410 completely toothless jaws belonging to 371 consecutive patients. They defined osseointegration as a firm, direct and lasting connection between living bone and the implant with no tissue in between, and they were explicit that it could only be achieved by gentle surgery, a long healing period and sensible distribution of load. In the group observed for five to nine years, 81% of upper-jaw fixtures and 91% of lower-jaw fixtures remained stable and supporting bridges, and the bridges themselves stayed continuously in function in 89% of upper jaws and 100% of lower jaws.
Read those numbers against today's marketing figure and they look poor. Read them against 1981 and they were revolutionary: a fixture that failed in the upper jaw one time in five was still a treatment nothing else could touch. More important for what followed, the paper established the pattern of bone loss that every study since has used as its benchmark — an average of 1.5 mm lost during healing and the first year of function, then about 0.1 mm a year after that. That is the shape of a healthy implant's life in bone. Fast early settling, then near stillness.
Five years later Albrektsson, Zarb, Worthington and Eriksson turned that pattern into a definition. Their 1986 criteria are the ones I still measure against: an implant that is immobile when tested, shows no radiolucent zone around it on a radiograph, loses less than 0.2 mm of vertical bone per year after its first year in function, and causes no pain, infection, or nerve disturbance. They proposed that a system should reach 85% success at five years and 80% at ten before it could be called acceptable. Those thresholds sound low now. They were meant as a floor, not a target, and their real contribution was to make success a measured thing rather than a felt one.
The ten-year reviews, read carefully
Two systematic reviews carry most of the weight behind the figures you will see quoted. Moraschini and colleagues, in 2015, pooled 23 longitudinal studies — ten prospective, nine retrospective, four randomized — covering 7,711 implants with a mean follow-up of 13.4 years. Cumulative survival was 94.6%, and mean marginal bone loss was 1.3 mm. Only fourteen of the 23 studies reported a success rate at all, and the authors were candid that the outcome measures across the field were too disparate to pool. So the number that survived into every brochure is a survival figure, from studies that mostly could not say whether the surviving implants were healthy.
Howe, Keys and Richards did something more demanding in 2019. They restricted their review to contemporary designs — solid screws with roughened surfaces — and to prospective studies with at least ten years of follow-up, which left eighteen. The conventional estimate of ten-year survival was 96.4%, with a 95% confidence interval of 95.2% to 97.5%. Then they asked the uncomfortable question every long study tries not to ask: what happened to the patients who stopped coming back? A sensitivity analysis that imputed plausible outcomes for the missing dropped the estimate to 93.2%, with a prediction interval — the range a new study might reasonably land in — of 76.6% to 100%. In the same analysis, patients aged 65 and over had a survival of 91.5%, which the authors described as a possible doubling of the risk of implant loss in older groups.
That is the paper I trust most, precisely because its headline is less flattering. Ninety-six percent is what you get if everyone who vanished from a study is assumed to be fine. Ninety-three percent is closer to what a surgeon should expect over a decade across a mixed population. Against both sits the best-case cohort: Buser's 2012 report of 511 sandblasted, acid-etched implants in 303 partially edentulous, orally healthy patients with a mean age of 48, followed for ten years at one center. Six implants were lost, a survival of 98.8%; 97.0% met strict success criteria; and the ten-year prevalence of peri-implantitis was 1.8%. One surface, one team, healthy mouths. That is the ceiling, and it is worth knowing how far above the average it sits.
The implant survives; the crown is another matter
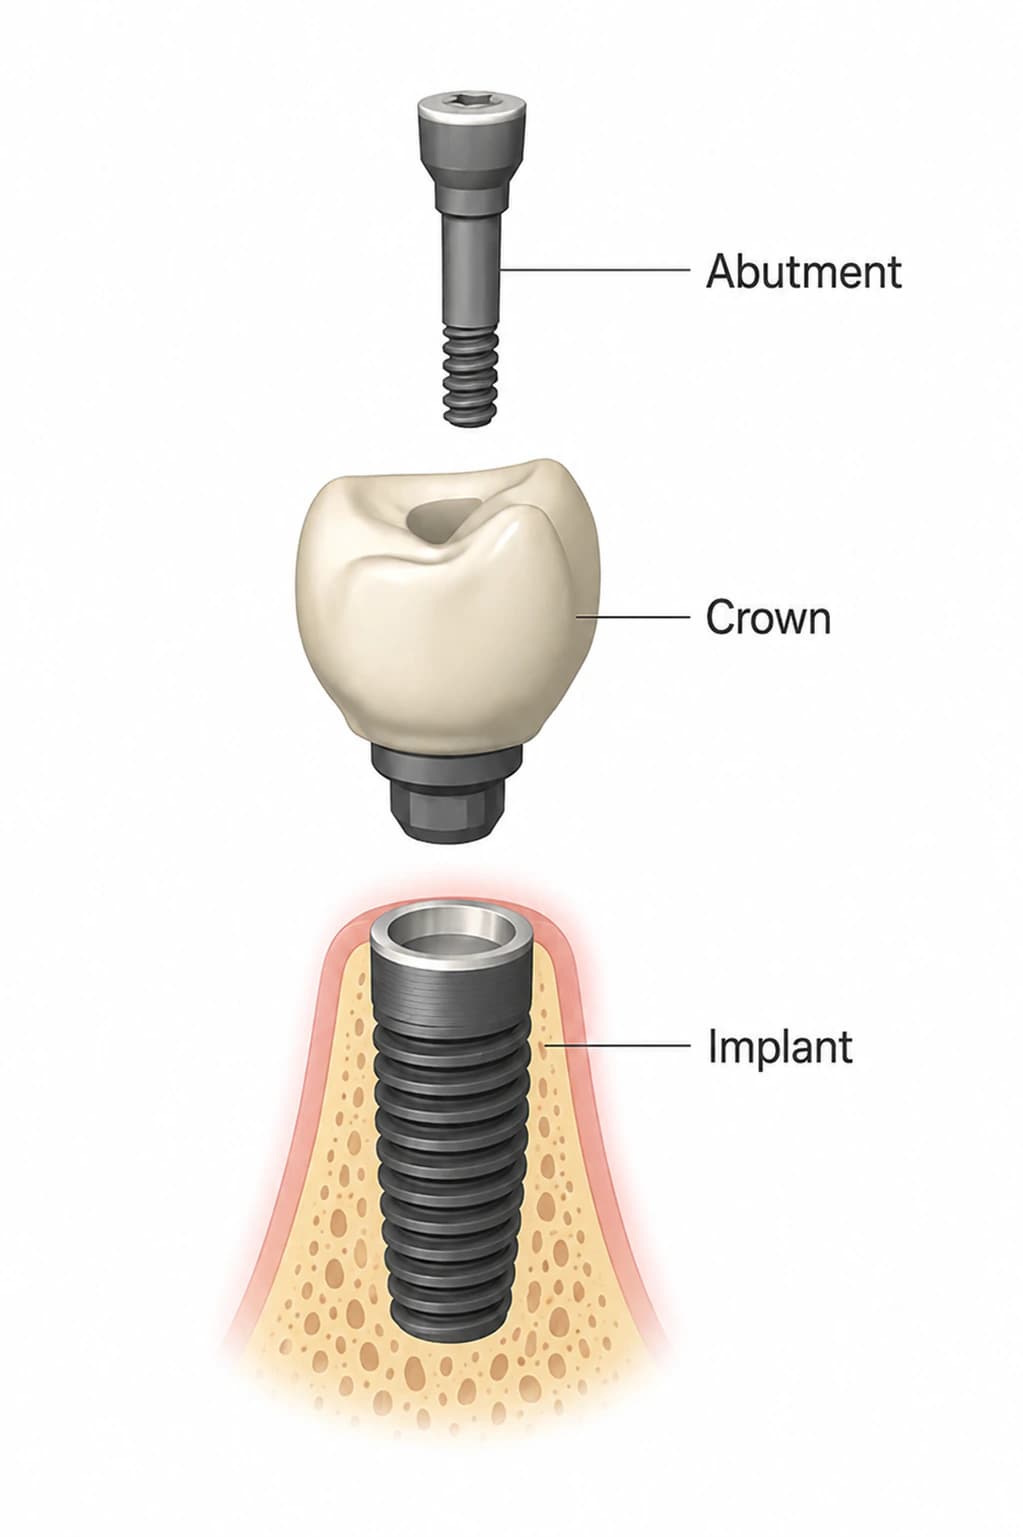
The figures above are for the titanium in the bone. What sits on top of it has a shorter life, and patients are rarely told so. Jung and co-authors reviewed 46 studies of single crowns on implants in 2012. The implants survived at 97.2% after five years and 95.2% after ten. The crowns on them survived at 96.3% after five years and 89.4% after ten. Within five years, 8.8% of crowns had a loosened screw, 4.1% had lost retention, 3.5% had fractured their veneering porcelain, 7.1% had a soft-tissue complication, 5.2% had lost more than 2 mm of bone, and 7.1% had an aesthetic problem the patient or dentist judged worth recording.
For implant-supported bridges the gap is wider. Pjetursson's companion review of 32 studies put implant survival at 95.6% at five years and 93.1% at ten — rising to 97.2% at five years when only rough-surface implants were counted — but bridge survival at 95.4% at five years and 80.1% at ten. Only 66.4% of patients were free of any complication after five years. The most frequent were fractures of the veneering material at 13.5%, peri-implantitis and soft-tissue complications at 8.5%, loss of the screw-access filling at 5.4%, abutment or screw loosening at 5.3%, and loss of retention of a cemented bridge at 4.7%. Metal-ceramic bridges did better than the older gold-acrylic designs, at 96.4% and 93.9%.
There is real good news in the trend. When Pjetursson's group compared 31 studies published up to 2000 with 108 published after it, five-year prosthesis survival had climbed from 93.5% to 97.1%, and screw-retained reconstructions from 77.6% to 96.8% — the single largest improvement in the field. Aesthetic complications fell; biological ones did not; and minor technical complications were reported more often, which the authors read partly as better reporting. My conclusion is the one I explain to every patient: the implant is the durable part, and the teeth on it are the maintenance item. That is why I favor screw-retained, retrievable designs, and why having the laboratory down the hall matters more for the twentieth year than the first.
Registry data: what happens outside university clinics
Almost everything above comes from selected patients treated by experienced teams. In 2015 Derks and colleagues did the opposite. Using Sweden's national social-insurance register, they randomly selected 4,716 patients who had received implants in 2003, retrieved the records of 2,765 of them — 11,311 implants placed by more than 800 different clinicians — and examined 596 of those patients nine years later. Early implant loss, before the teeth were attached, occurred in 4.4% of patients (1.4% of implants). Late loss occurred in 4.2% of the patients examined at nine years (2.0% of implants). In total, 7.6% of patients had lost at least one implant. Smokers, patients with a periodontitis diagnosis, implants shorter than 10 mm, and certain brands carried higher odds of early loss. Their closing line deserves quoting: implant loss is not an uncommon event.
A single-clinic series from Malmö tells the same story from the inside. Chrcanovic and co-workers analyzed 10,096 implants placed in 2,670 patients between 1980 and 2014. Overall, 642 implants — 6.36% — failed, 176 of them (1.74%) before the abutment was connected. In the multivariate model the significant predictors of early failure were smoking and the use of antidepressants. The same group's 2014 review of the reasons implants fail lists the pattern I see in referrals: low insertion torque on implants loaded immediately, inexperienced surgeons, the upper jaw and the back of either jaw, heavy smokers, soft type III and IV bone, small bone volumes, shorter implants, and a lack of initial stability. They also noted that modern moderately rough surfaces appear to blunt several of those penalties.
Here is how I reconcile 96% with 7.6%. The first is an implant-level figure; the second counts patients. A patient with six implants and a 2% per-implant loss rate has roughly an eleven percent chance of losing at least one of them. That is the honest number to give someone planning a full-arch case, and it is why a full-arch plan should assume an implant might be lost and still hold — spare capacity in the design is not over-engineering, it is arithmetic.

What moves a patient toward the top of the range
Every factor on Chrcanovic's list is either something I can measure before surgery or something the patient controls. Bone quality and volume are read on the 3D scan before a drill is chosen. Insertion torque is measured, not guessed, and decides whether an implant is loaded that day or left to heal. Length and position are planned around the anatomy rather than around what is convenient. Surgeon experience is the factor no patient can change, but every patient can ask about it, and should.
The two patient-side factors with the most evidence behind them are tobacco and a history of gum disease. Both show up in the Swedish registry and the Malmö series, and both are dealt with before I schedule surgery rather than after something goes wrong. If you smoke, read this before booking. If you have lost teeth to periodontitis, your maintenance schedule after surgery is part of the treatment, not an afterthought — the care guide explains what that looks like. And if an implant has already failed, that is not the end of the road; this is what the options are.
You will notice I do not publish a practice survival rate on this page. That is deliberate. A figure without its denominator, its follow-up period, and its definitions attached would be exactly the kind of number this article argues against. What I can tell you is what the studies say about a case like yours once I have seen your scan, and what is written into our warranty if the unlikely happens.
Where the research has to go next
The field still lacks a single agreed definition of success, forty years after Albrektsson proposed one. Until reviews can pool success rather than survival, the number patients most want — how many implants are still healthy at ten years — will remain harder to find than it should be. Reporting at the patient level, as Derks did, rather than the implant level, would change how surgeons counsel people with several implants, and it should become standard.
The second gap is age. Howe's finding that survival may be lower in patients over 65 comes from a subgroup analysis and needs prospective confirmation, because the average implant patient is getting older every year. I have written separately about what age does and does not change. Finally, the United States has nothing like Sweden's register. A national outcomes registry, with random sampling and independent examination, would tell American patients what their real odds are rather than what a selected cohort's were. The rest of the evidence I rely on is summarized on its own page.
Written and medically reviewed by Dr. Sam Jain, DMD, MS, and Dr. Arpana Gupta, DDS, MDS, who own this practice. Reviewed
This article is patient education, reviewed by Dr. Sam Jain, DMD, MS, and Dr. Arpana Gupta, DDS, MDS, and is not a substitute for an exam. Treatment recommendations are made only after an in-person consultation and 3D imaging.